
The Intelligence Report Dashboard visualizes data across your teams Intelligence Reports in new and exciting ways. It allows you and your team to filter and sort across many data variables, and export data to a CSV file.
The dashboard includes a combination of filters, sections, and export functions to enable you and your team to get to your most important opportunities easier.
Here's a video showing you how to navigate your Intelligence Report Dashboard, but if you prefer an article breaking down each section in the Dashboard, scroll below this video:
Export to CSV File:
For any of the tables in your IR Dashboard, you are able to export the information to a CSV file. To do this, click on the three dot icon above the table, highlighted below and choose Export:

Below also shows a breakdown of each section with associated navigation details:

1) Date Range Filter
-
On the top left hand corner you will find the ability to filter your opportunities by a defined date range.
-
Select a start date for your range, and an end date. Click apply to see this date range filter applied to your dashboard results.
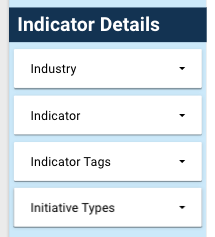
2) Filter by Indicator Details
-
Beneath the date range filter, you will see a section of filters labeled Indicator Details.
-
Here you will have the ability to include / and or exclude any indicator industry, indicator, indicator tag, and initiative types.
-
Select / unselect any of the dropdown options, and click anywhere outside of the dropdown list to see your filter applied to your dashboard results.
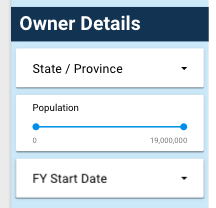
3) Filter by Owner Details
-
Beneath the Indicator Details filters, you will see a section of filters labeled Owner Details.
-
Here you will have the ability to include / and or exclude any state / and or province, along with any fiscal year date.
-
Select / unselect any of the dropdown options, and click anywhere outside of the dropdown list to see your filter applied to your dashboard results.
-
You also have the ability to filter your opportunities by population size. Drag the population markers to define your ideal population size, and watch the dashboard filter your results.
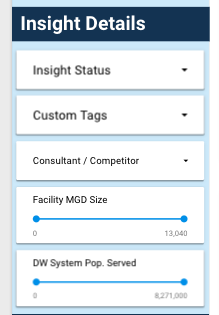
4) Filter by Insight Details
-
Beneath the Owner Details filters, you will see a section of filters labeled Insight Details.
-
Here you will have the ability to include / and or exclude any insight status, custom tags (if your team is subscribed to this feature), consultant / and or competitor (if your team is subscribed to this data), Wastewater Facility MGD Size (if your team receives wastewater facility data), and Drinking Water System Population Served (if your team receives drinking water system data).
-
Select / unselect any of the dropdown options, and click anywhere outside of the dropdown list to see your filter applied to your dashboard results.
-
Drag the range markers for Facility MGD Size and or Drinking Water System Population Served, and watch the dashboard filter your results.
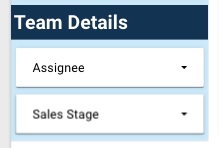
5) Filter by Team Details
-
Beneath the Insight Details filters, you will see a section of filters labeled Team Details.
-
Here you will have the ability to include / and or exclude any Opportunity Assignee, and or sales stage.
-
Select / unselect any of the dropdown options, and click anywhere outside of the dropdown list to see your filter applied to your dashboard results.
How Do I Reset any of my applied filters?
To reset any applied filters, simply refresh the page.
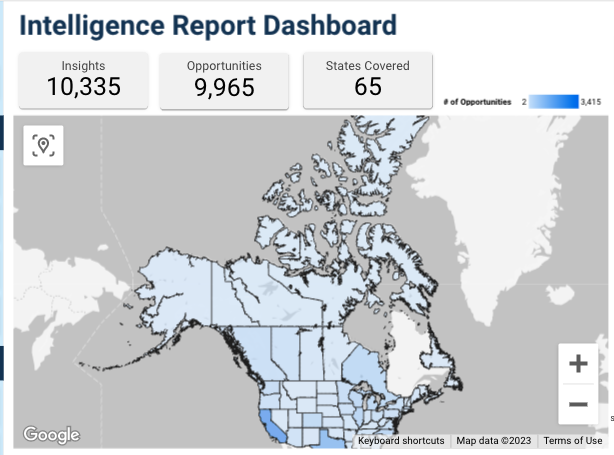
6) Map of Opportunities by your State / Province
-
In the top center, you will see a module with a visual map of opportunities.
-
Select a state and or province to filter your dashboard quickly by this selection.
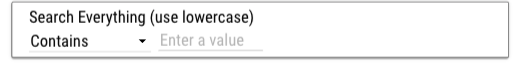
7) Dashboard Search
-
On the top right hand side, you will see a search bar.
-
This search bar allows the ability to select a few options like:
-
Contains
-
Equals
-
Starts With
-
Regex
-
-
Search any term across any data column available in your dashboard.
-
Press enter to apply your search.
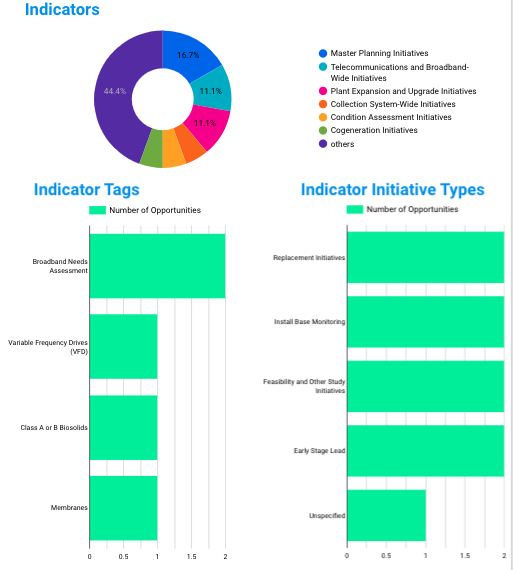
8) Graphs of Opportunities by Indicator, Indicator Tag and Indicator Initiative Type
-
Beneath the search bar, you will see a group of graphs displaying your opportunities by:
-
Indicator
-
Indicator Tag
-
Indicator Initiative Type
-
-
Select any of these options to quickly filter your dashboard by your selection.
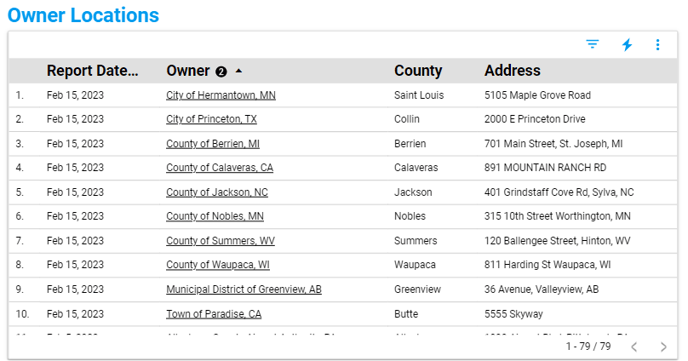
9) Table of Opportunities by Owner Location
-
Beneath the Map, you will see a section with a table of opportunities along with their locations.
-
The table includes the following data:
-
Report Date
-
Opportunity Owner (City/Town Name)
-
County
-
Address
-
-
To see the full details of an opportunity, click on the owner name to view the Citylitics Single Opportunity View.
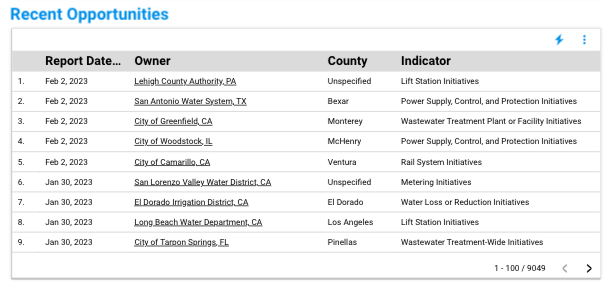
10) Table of your Team’s Most Recent Opportunities
-
Beneath the Owner Locations table, you will see a table of your teams most recently delivered opportunities. This table shows ALL the opportunities delivered to your team in chronological order, starting with the most recent opportunities (most recent report).
-
The table includes the following data:
-
Report Date
-
Opportunity Owner
-
County
-
Indicator
-
-
To see the full details of an opportunity, click on the owner name to view the Citylitics Single Opportunity View.
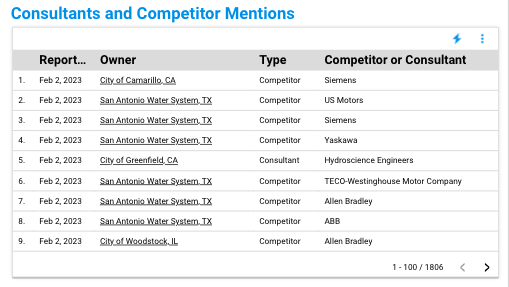
11) Table of Opportunities by Consultant and / or Competitor
-
To the right of the Recent Opportunities Table, and beneath the Indicator graphs, you will see the Consultant and Competitor Mentions (If your team is subscribed to this data).
-
Within this table, you will see the following data:
-
Report Date
-
Opportunity Owner
-
Type (whether the company is a consultant or competitor associated to the opportunity)
-
Competitor or Consultant Name
-
-
To see the full details of an opportunity, simply click on the owner name to view the Citylitics Single Opportunity View.
-
If you are not currently subscribed to consultant and or competitor data but are interested in exploring this feature, please contact your Customer Success Manager, or help@citylitics.com.
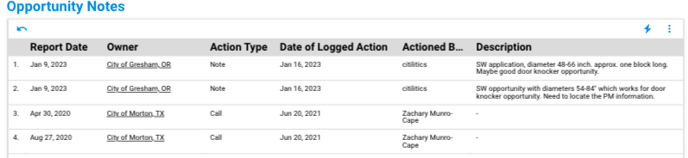
12) Table of Opportunities by Notes and Actions Taken
-
Beneath the Recent Opportunities Table, you will see the Opportunity Notes section.
-
Here you will see a table with the following data:
-
Report Date
-
Opportunity Owner
-
Action Type (Note, Call, Email, Shared)
-
Date of Logged Action
-
Actioned By
-
Description
-
-
To see the full details of an opportunity, simply click on the owner name to view the Citylitics Single Opportunity View.
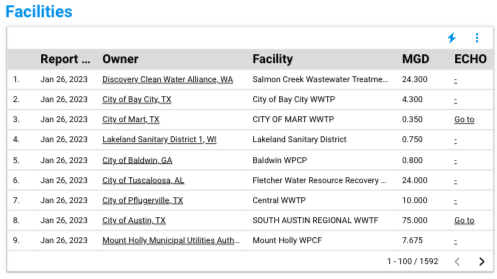
13) Table of Opportunities by Wastewater Treatment Facility
-
To the right of the Opportunity Notes Table, you will see the Facilities Table (if your team is subscribed to wastewater facility data).
-
Within this table, you will see the following data:
-
Report Date
-
Opportunity Owner
-
Wastewater Treatment Facility Name
-
MGD
-
ECHO Link (if available)
-
-
To see the full details of an opportunity, simply click on the owner name to view the Citylitics Single Opportunity View.
-
If you are not currently subscribed to Wastewater data but are interested in exploring this feature, please contact your Customer Success Manager, or contact help@citylitics.com
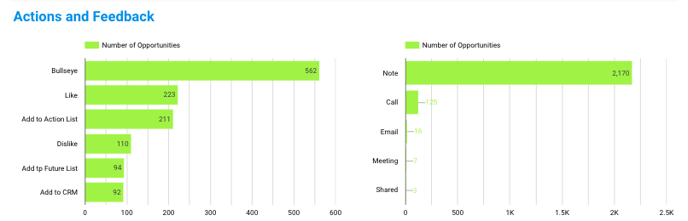
14) Graphs of Opportunities by Feedback Provided and Action Taken
-
Beneath the Opportunity Notes Table, you will see the Actions and Feedback graphs.
-
The graph on the left represents your opportunities by feedback provided through the Fast Feedback options.
-
The graph on the right represents your opportunities by Notes Logged or Actions Taken.
-
Select any of the bars in either of the graphs to quickly filter your dashboard results.
- You are able to export the information in these graphs by clicking the three dot icon as shown below and choosing Export:

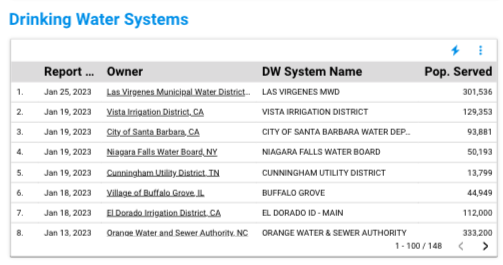
15) Table of Opportunities by Drinking Water System
-
To the right of the Actions and Feedback Graphs, you will see the Drinking Water Systems Table (if your team is subscribed to drinking water system data).
-
In this table, you will see the following data:
-
Report Date
-
Opportunity Owner
-
Drinking Water System Name
-
Population Served
-
-
To see the full details of an opportunity, simply click on the owner name to view the Citylitics Single Opportunity View.
-
If you are not currently subscribed to Drinking Water data but are interested in exploring this feature, please contact your Customer Success Manager, or contact help@citylitics.com.
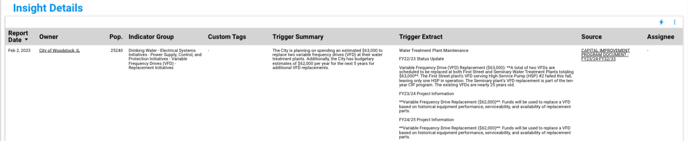
16) Table of Opportunities by Insight Details
-
Beneath the Actions and Feedback Graphs, you will see the Insight Details Table.
-
Within this table you will see the following data:
-
Report Date
-
Opportunity Owner
-
Population
-
Indicator Group
-
Custom Tags (if you are subscribed to this feature)
-
Trigger Summary
-
Trigger Extract
-
Source
-
Opportunity Assignee
-
-
To see the full details of an opportunity, simply click on the owner name to view the Citylitics Single Opportunity View.
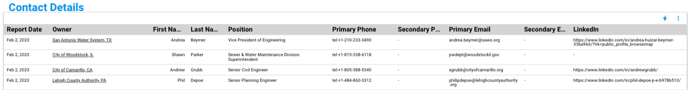
17) Table of Opportunities by Contact
-
Beneath the Insight Details Table, you will see the Contact Details Table (If your team is subscribed to this data).
-
Within this table you will see the following data:
-
Report Date
-
Opportunity Owner
-
First name
-
Last name
-
Position
-
Primary Phone Number
-
Secondary Phone Number
-
Primary Email
-
Secondary Email
-
LinkedIn URL (if available)
-
-
To see the full details of an opportunity, simply click on the owner name to view the Citylitics Single Opportunity View.
-
If you are not currently subscribed to contact data but are interested in exploring this feature, please contact your Customer Success Manager, or contact help@citylitics.com
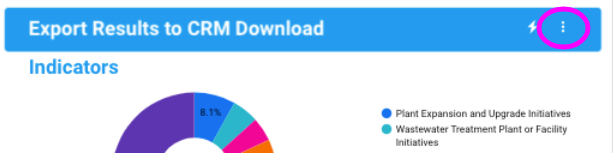
18) Export Results to CRM Download
-
At the top right hand corner, beneath the search feature you will see the ability to export your results to a CRM friendly Download.
-
Click on the 3 dot icon on the right hand side of the blue bar, and select “Export”.
-
Choose your file format of choice, and export your results.
-
Custom CRM Templates - If you are interested in having a custom CRM template supported to enable easier importing, please contact your Customer Success Manager, or contact help@citylitics.com