The Fast Feedback features allow you and your team to review opportunities and provide feedback on what's been delivered to you.
What are the Fast Feedback Features?
The Fast Feedback features are a collection of icons and checkboxes that allow you and your team to provide feedback, and categorize opportunities. The collection of fast feedback features contain the following:
|
|
Active |
Inactive |
|---|---|---|
|
Dislike This opportunity does not align with what you or your team are looking for, and you would not like to see opportunities like these in the future. |

|

|
|
Like This opportunity aligns with what you or your team are looking for, and you would like to see opportunities like these in the future. |

|

|
|
Add to CRM This opportunity will be or has been added to our team's CRM system. |

|

|
|
Bullseye This opportunity is exactly what your team wants to see. This is your ideal opportunity, and you would like to see more of these. |

|

|
|
Add to Action List This opportunity will be actioned, or is currently being actioned. |
.png?width=68&height=70&name=Screen%20Shot%202023-01-31%20at%209.42.56%20PM%20(1).png)
|
.png?width=74&height=68&name=Screen%20Shot%202023-01-31%20at%209.43.28%20PM%20(1).png)
|
|
Add to Future List This is an opportunity that your team would like to monitor for future potential/reach out.. |

|

|
Where can the Fast Feedback Features be found?
The Fast Feedback features can be found in:
-
Report View - How to Access all Your Reports
-
All Opportunities View - How to Access All Your Opportunities

- Single Opportunity View

Myself and / or my team has provided feedback on a few opportunities, how can I view opportunities by Feedback provided?You and your team have the ability to view opportunities by feedback provided on the Intelligence Report Dashboard. Check out this article if you're unfamiliar with the Intelligence Report Dashboard.
-
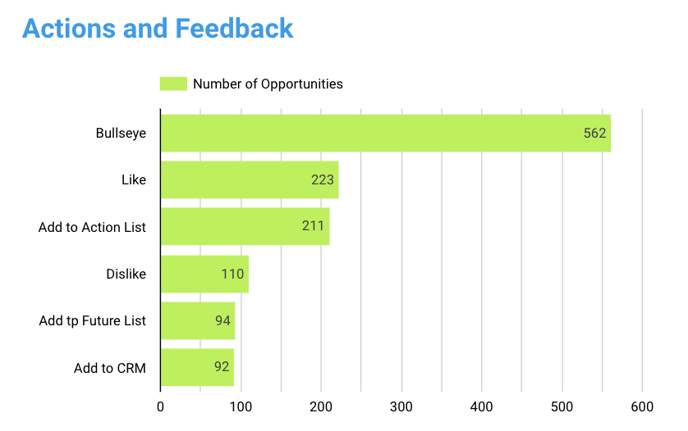
Beneath the Opportunity Notes, you will see the Actions and Feedback Graphs.
-
The graph on the left represents your opportunities by feedback provided.
-
Select any of the bars in either of the graphs to quickly filter your dashboard results.